With any sizable project that takes testing seriously there arises a need to to deal with two problems test stability and test performance. These are crucial because if tests fail randomly people lose trust in the test suite and don’t run them or ignore real failures. If they take too long to run a culture of not running the tests for “minor changes” will emerge.
In both cases it is interesting to look at the tests over time, i.e. to analyse old and new test behaviour. In the Java and in the Scala world most build tools write the results for each build into xml files – usually one per test suite. An example would look like this:
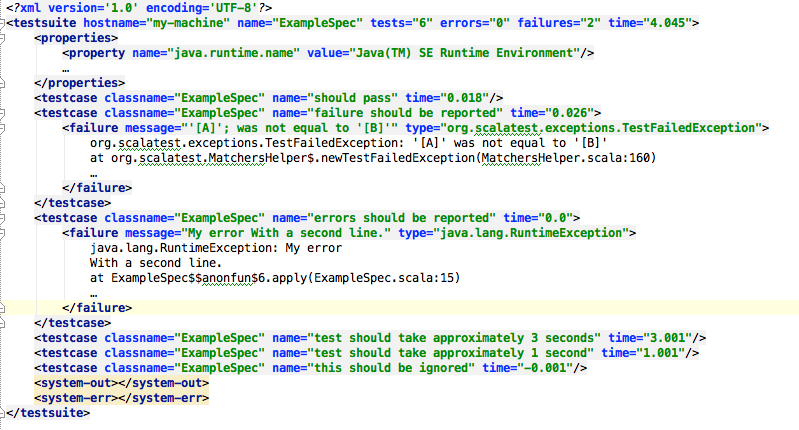
While this has the advantage of having a lot of information for trouble shooting (though stdout and stderr are problematic when executing tests concurrently), it is not so easy to extract information about particular test cases. It is especially difficult to answer questions like “What are the slowest 5 test cases?” and “How did the duration of test XYZ change over time?”. Historically I tried to deal with this using tools like xqilla which brings the power of xquery to the command line, but it always felt a bit backwards.
So instead I thought I should change the format that these reports are written in.
My first hunch was to put important information about each test case could go into a row in a csv style table file. As I am currently mostly using SBT, I started writing a tabular testreporter plugin.
To allow the simple use of tools like awk, sort and uniq I decided to go for a simple format where fields are separated by whitespace – even though that means I had to replace whitespace in the test names with underscores.
Now the example from above renders to something like this:
2015-02-23T00:30:40 SUCCESS    0.014 ExampleSpec should_pass
2015-02-23T00:30:40 FAILURE    0.023 ExampleSpec failure_should_be_reported "[A]" was not equal to "[B]"
2015-02-23T00:30:40 FAILURE      0.0 ExampleSpec errors_should_be_reported My error
2015-02-23T00:30:40 SUCCESS    2.001 ExampleSpec test_should_take_approximately_2_seconds
2015-02-23T00:30:40 SUCCESS    0.501 ExampleSpec test_should_take_approximately_0.5_seconds
2015-02-23T00:30:40 IGNORED      0.0 ExampleSpec this_should_be_ignored
2015-02-23T00:30:40 SUCCESS    0.406 AnotherSpec this_should_take_more_time
2015-02-23T00:30:40 SUCCESS      0.0 AnotherSpec a_rather_quick_test
2015-02-23T00:30:40 FAILURE    0.015 AnotherSpec i_am_flaky 0.4044568395582899 was not less than 0.3
Finding the three test cases that take the most time is a trivial exercise using sort:
cat target/test-results-latest.txt \
    | sort --numeric --reverse --key=3 \
    | head -n 3
Which yields the following:
2015-02-22T00:30:40 SUCCESS    2.001 ExampleSpec test_should_take_approximately_2_seconds
2015-02-22T00:30:40 SUCCESS    0.501 ExampleSpec test_should_take_approximately_0.5_seconds
2015-02-22T00:30:40 SUCCESS    0.406 AnotherSpec this_should_take_more_time
By having multiple files around we can now also analyse the behaviour of a specific test case over time:
find target/test-reports/ -name "*.txt" \
    | xargs cat \
    | grep "AnotherSpec this_should_take_more_time"
Which will produce the following report:
2015-02-22T09:22:45 SUCCESS    0.651 AnotherSpec this_should_take_more_time
2015-02-22T09:22:59 SUCCESS    0.609 AnotherSpec this_should_take_more_time
2015-02-22T09:23:10 SUCCESS     0.69 AnotherSpec this_should_take_more_time
2015-02-22T09:24:27 SUCCESS    0.498 AnotherSpec this_should_take_more_time
2015-02-22T09:24:49 SUCCESS    0.723 AnotherSpec this_should_take_more_time
2015-02-22T09:25:01 SUCCESS     0.51 AnotherSpec this_should_take_more_time
2015-02-22T09:28:38 SUCCESS    0.306 AnotherSpec this_should_take_more_time
2015-02-22T09:38:27 SUCCESS    0.568 AnotherSpec this_should_take_more_time
2015-02-22T09:47:17 SUCCESS    0.558 AnotherSpec this_should_take_more_time
2015-02-22T09:47:44 SUCCESS    0.884 AnotherSpec this_should_take_more_time
Analysing non-deterministic test outcomes is another interesting use case:
find target/test-reports/ -name "*.txt" \
    | xargs cat \
    | awk '{print $4, $5, $2}'  \
    | sort \
    | uniq -c
This produces the following output:
  10 AnotherSpec a_rather_quick_test SUCCESS
   6 AnotherSpec i_am_flaky FAILURE
   4 AnotherSpec i_am_flaky SUCCESS
  10 AnotherSpec this_should_take_more_time SUCCESS
  10 ExampleSpec errors_should_be_reported FAILURE
  10 ExampleSpec failure_should_be_reported FAILURE
  10 ExampleSpec should_pass SUCCESS
  10 ExampleSpec test_should_take_approximately_0.5_seconds SUCCESS
  10 ExampleSpec test_should_take_approximately_2_seconds SUCCESS
  10 ExampleSpec this_should_be_ignored IGNORED
It becomes clear that the i_am_flaky test case is not deterministic and failed 6 times, while succeeded only 4 times.
Harnessing the power of unix to analyse test results helps to debug the most common problems with automated tests. Also, because of the simple scriptability ad-hoc analyses can be turned into proper reports if they proof useful. I would love to see this kind of reporting in other build tools as well.
If you are using sbt you can give the tabular-test-reporter a go now by simply adding this to your plugins.sbt:
addSbtPlugin("org.programmiersportgruppe.sbt" %% "tabulartestreporter" % "1.4.1")
I have been using this for a couple of days now, so your feedback is very welcome!